Fluent Bit is a fast and lightweight log processor, stream processor and forwarder. It’s gained popularity as the younger sibling of Fluentd due to its tiny memory footprint(~650KB compared to Fluentd’s ~40MB), and zero dependencies - making it ideal for cloud and edge computing use cases.
In this series of posts, I’ll share my research, issues and workarounds in getting a lab set up for logging in a single Kubernetes cluster. I’ll also share techniques to separate logs by namespaces.
High-level overview
As a lightweight component of the logging infrastructure, Fluent Bit can ship logs directly to many destinations. As of today, there are 21 output plugins listed on the Fluent Bit website. However, Fluent Bit alone may not be sufficient for certain use cases.
A common request seen in the field is to ship platform logs and application logs to different destinations and also augment the log record’s fields with additional metadata. This guide documents a conceptual architecture to achieve this, and steps to deploy a MVP that demonstrates the use case.
Logging Architecture
Reading the following diagram from left to right, Fluent Bit is deployed as a Daemonset in the Kubernetes cluster. The Fluent Bit pods are configured to read directly from the node’s /var/log/containers/*.log files, and must be given the appropriate permissions to do so(and with no other privileges). These logs are then decorated with Kubernetes metadata such as pod name, namespace, and so on, using the Fluent Bit kubernetes filter plugin. At this stage, all output from Fluent Bit is tagged with a kube.* tag, in a single stream, and shipped using the forward plugin to Fluentd.
Fluentd is deployed as a StatefulSet, exposed internally within Kubernetes cluster as a Service called fluentd-headless. The incoming log entries from Fluent Bit are tagged with application(kube.*) or platform operations(kube-ops.*), using the rewrite_tag_filter plugin. These entries are then routed to their respective storage destination via their new tags. In this sample architecture, the storage destination happens to be Elasticsearch for all indices. In the wild, there could be unique and/or multiple destinations for each index - for example, application logs are sent to Elasticsearch, and platform operations logs are sent to LogInsight, and each type of log has a different retention period on the storage backend.
Elasticsearch is deployed external to the cluster, instead of inside Kubernetes. Having an external Elasticsearch instance to view platform operations logs could be useful for triage, if the Kubernetes cluster happens to be unavailable.
Finally, there are two points of access. First is the log viewer, who views logs through the Kibana web UI. Then there is the Elasticsearch operator, who uses Cerebro to view Elasticsearch health.

Design Considerations
Fluent Bit Memory Footprint and CPU Utilization
We will deploy both Fluent Bit and Fluentd in this architecture. The assumption is that we want to capitalize on the small CPU and memory footprint of Fluent Bit, while leveraging on the large plugin ecosystem available for Fluentd. There are also situations where removing the Fluentd aggregator makes sense too - balance your decision with the functionality required in your use case.
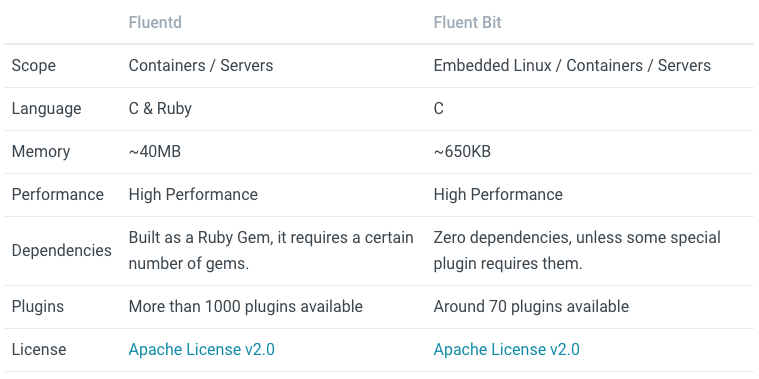
As seen above, the memory footprint for Fluentd can be ~60x of Fluent Bit.
The architecture in this document is a complementary pattern where Fluent Bit is deployed as a Daemonset(taking up a small footprint) to forward logs to a small number of Fluentd pods(deployed as a StatefulSet). The Fluentd rewrite_tag_filter and elasticsearch_dynamic plugins are then used to conditionally re-tag incoming log messages, to enable routing decisions to be made for where to store these logs.
Summary
In this post, I shared the motivation for using Fluent Bit, and why it can be used together with Fluentd in some cases, along with an overview of the architecture that we’ll deploy in this series.
In Part 2 and beyond, I’ll share the deployment steps.