Fluent Bit is a fast and lightweight log processor, stream processor and forwarder. It’s gained popularity as the younger sibling of Fluentd due to its tiny memory footprint(~650KB compared to Fluentd’s ~40MB), and zero dependencies - making it ideal for cloud and edge computing use cases.
This post is part 4(and the final part) in a series of posts about logging using Fluent Bit and the Fluentd forwarder in Kubernetes, and it describes the steps to view the result of our logging pipeline.
Other posts in this series:
Viewing the end result
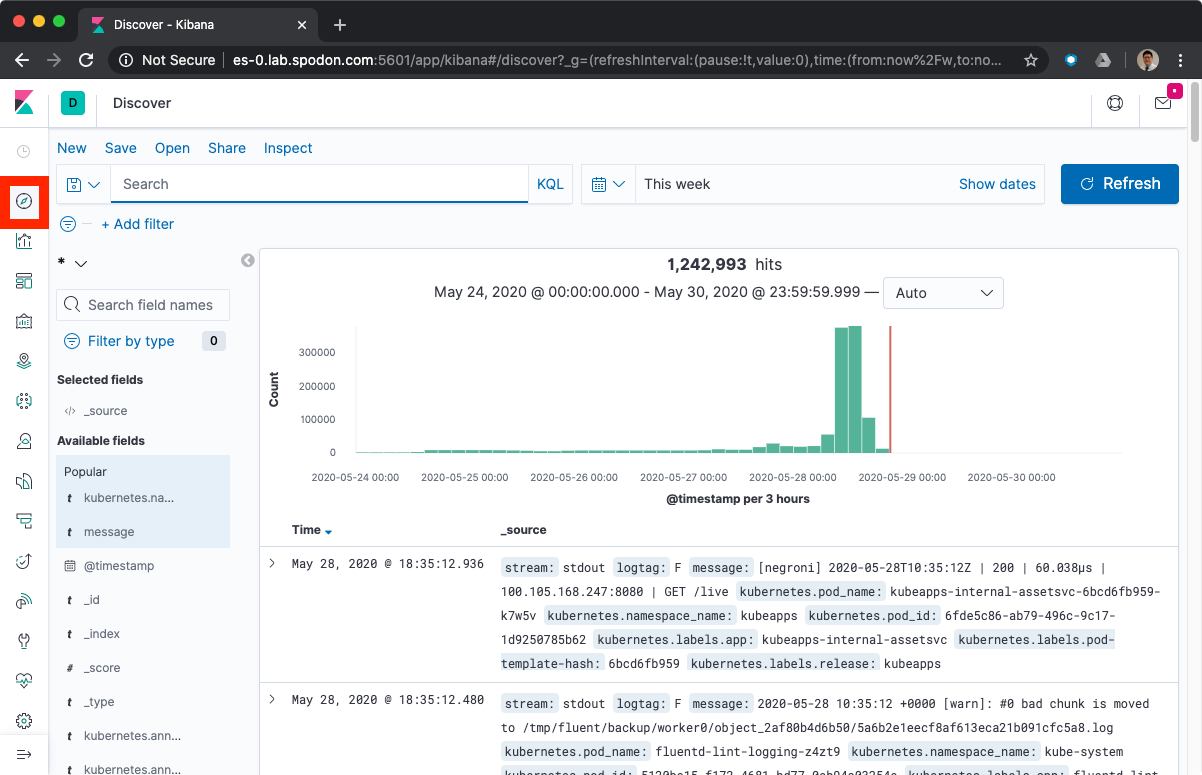
We have completed the deployment of the logging stack and we can now view logs in Kibana by navigating to it’s location http://<kibana-host>:5601/ and clicking on the Discover icon.
Creating separate views for applications and platform operations logs
-
Create the
kube.*index pattern. Click on the settings icon, then click onIndex Patterns.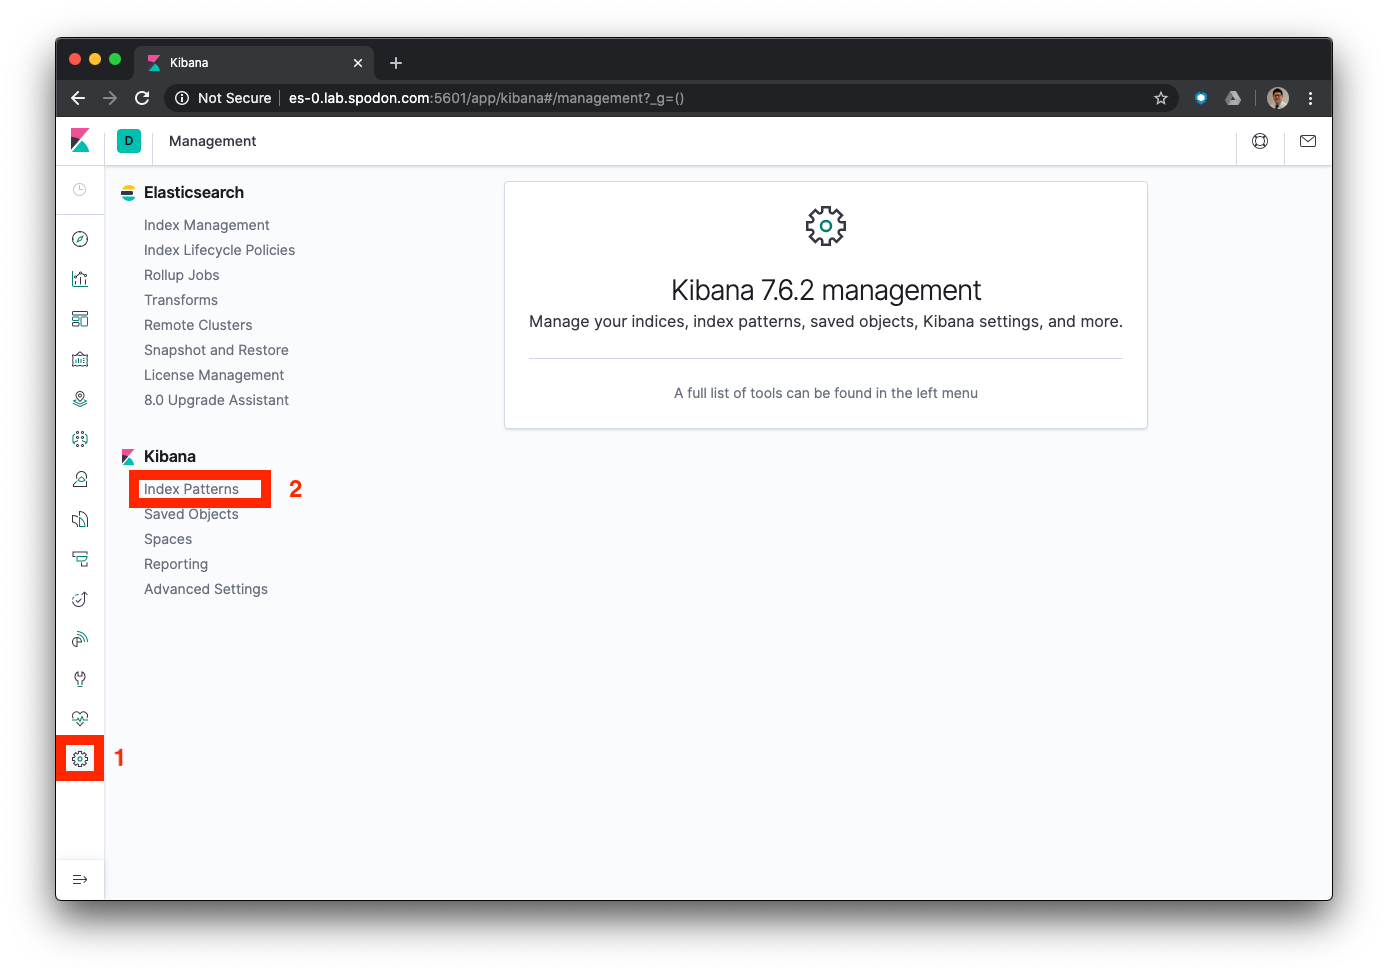
-
Click on
Create index pattern.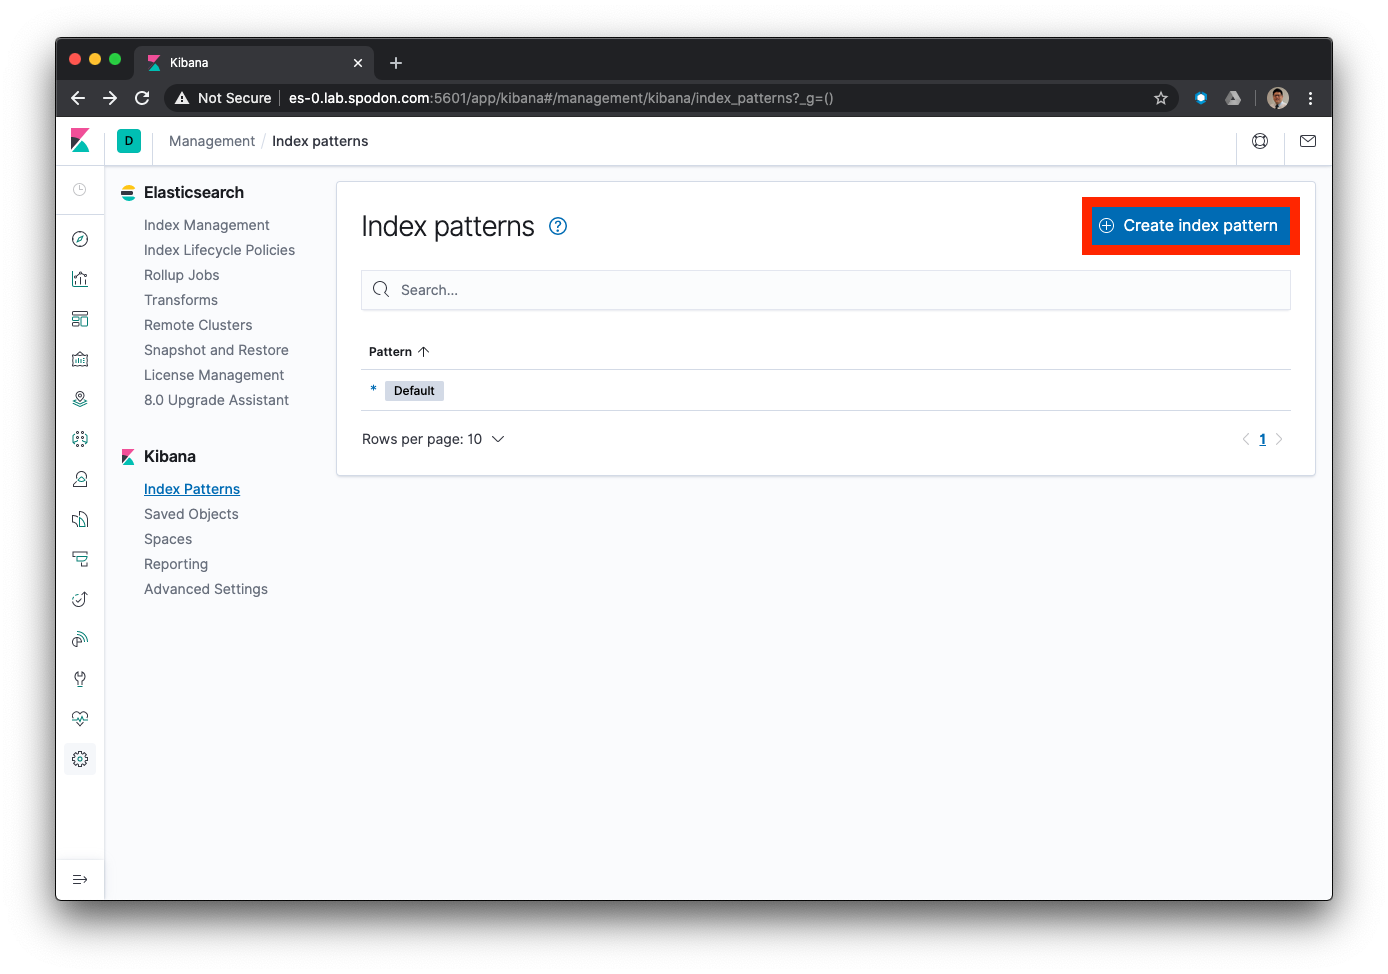
-
In the
Index patternfield, type inkube.*. You should see some matches to the pattern you just entered. ClickNext step.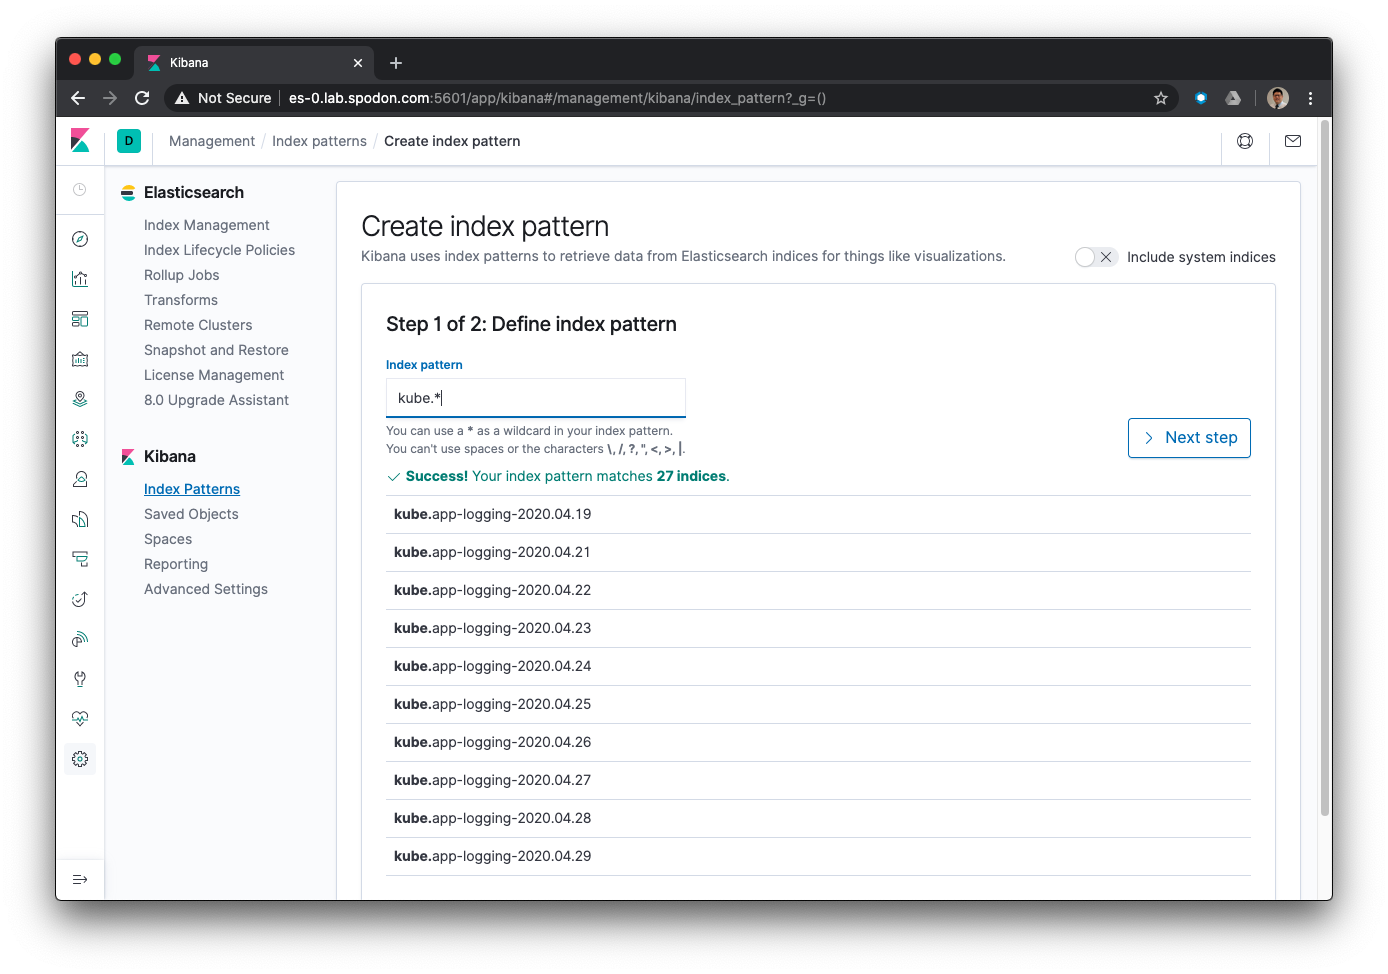
-
In the
Time Filter field namefield, select@timestamp, and thenCreate index pattern.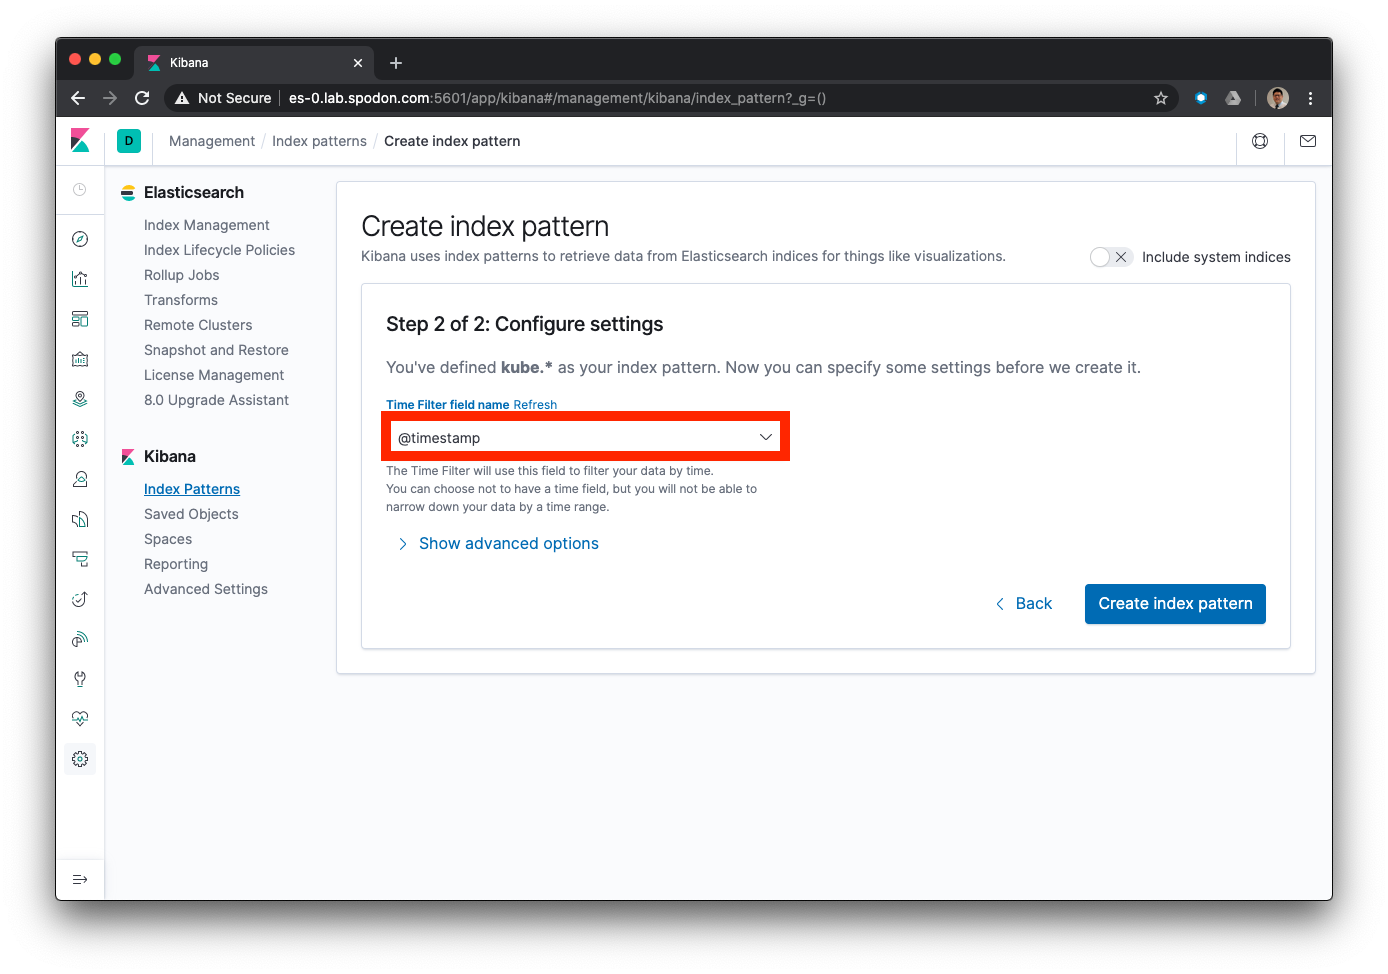
-
Repeat steps 1-4 for the index pattern
kube-ops.*. -
Navigate back to the
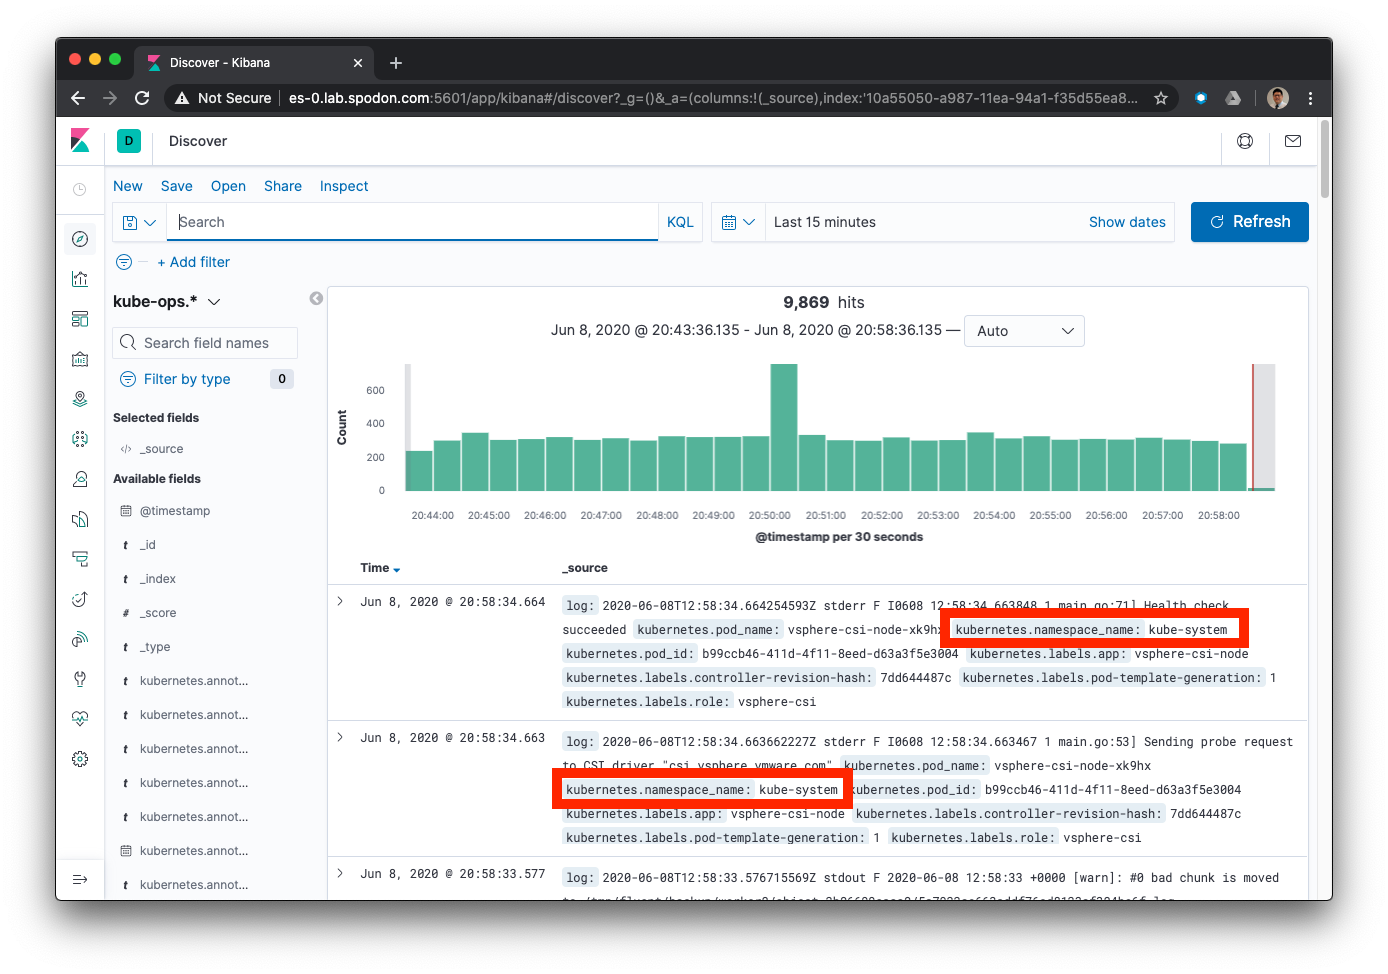
Discoverview, and click on the dropdown list for index patterns. You should be able to see the new index patterns you just created(kube-ops.andkube.). Selectkube-ops.*.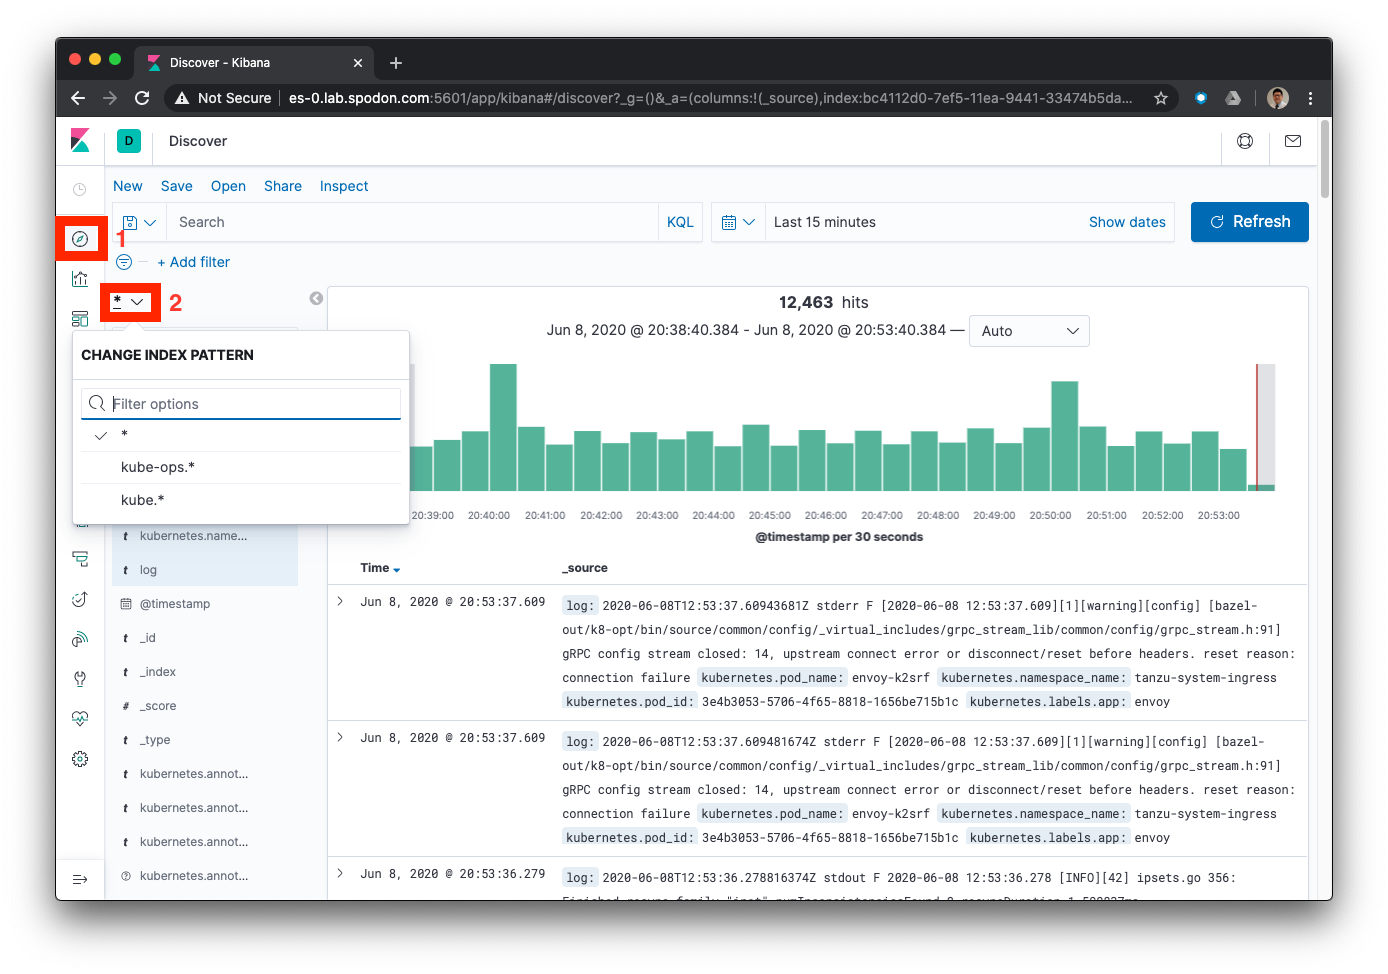
-
Notice that all logs displayed now are filtered to only come from the
kube-system,kubeapps, andk8s-system-*namespaces.
The kube-ops.* and kube.\* indices were created through the use of the Fluentd’s rewrite_tag_filter and routing capabilities. Now we can see the results in Elasticsearch and Kibana.
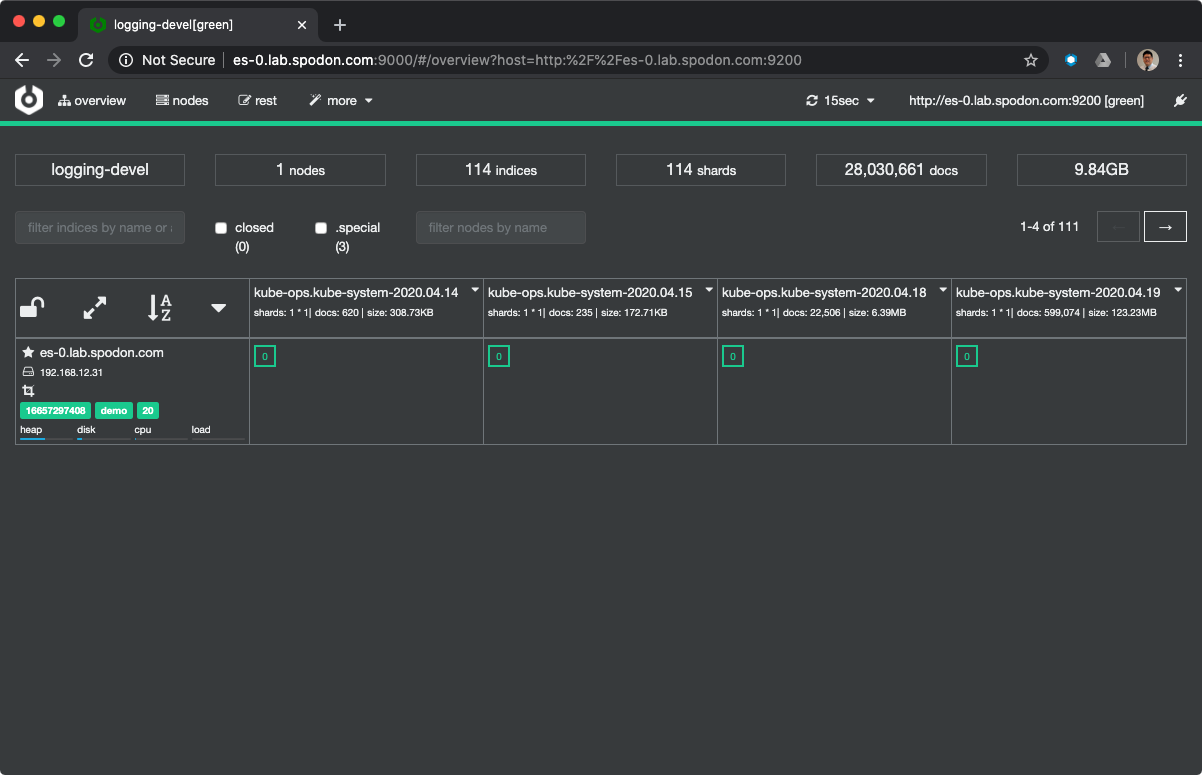
Cerebro
To view the health and status of Elasticsearch, navigate to the Cerebro UI http://<elasticsearch-hostname>:9000/. In the Node address text entry field, enter http://<elasticsearch-hostname>:9200. You should see a dashboard with green status and populated indices.
Summary
And that concludes this series on Logging with Fluent Bit and Fluentd in Kubernetes. I hope this has been useful if you’re just starting out building a Kubernetes logging pipeline.
There are many aspects which were not covered in this series, for example:
-
Security
-
Authentication and Authorization
-
Availability and Resiliency
-
Multi-cluster
-
Multi-site
These topics can get very deep, and I’m not able to cover all these aspects.
Nonetheless, I hope to this series has been useful wherever you found it and I welcome feedback!